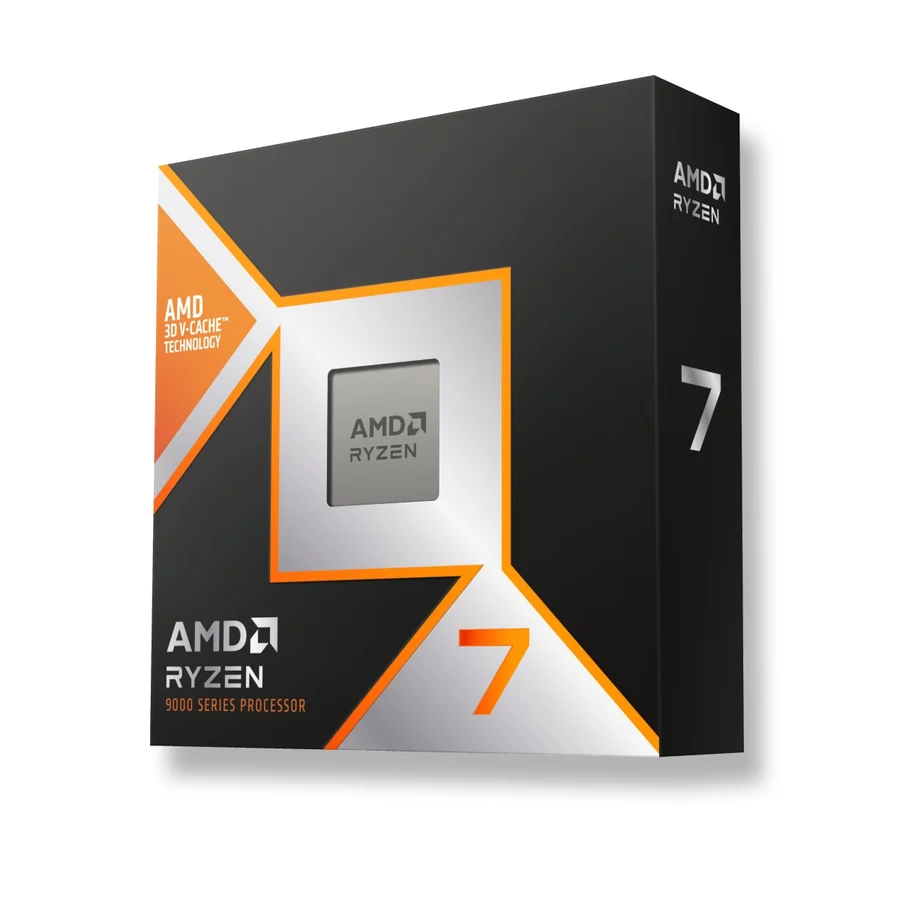
Choose Ryzen 7 9800X3D if…
The saving improves the rest of your PC, or you already own one. It remains close to the newer chip in the cited gaming tests while using less power in the cited comparison.
Read the review roundup →Processors / Buying comparison
Should you pay more for the Ryzen 7 9850X3D? Compare sourced gaming and power tests, AM5 build costs and the upgrade case against the 9800X3D.
By Next Interrupt · Analysis reviewed · 3 sources
Review roundups summarize published reviews; we haven’t tested these products. Links to retailers may earn us a commission. How we work
Our buying recommendation
The 9850X3D is easier to justify in a new gaming PC when the premium is small. Keep a working 9800X3D: the measured gaming gains are modest, and a saving on the older chip may do more for a new build when spent on the graphics card.
The saving improves the rest of your PC, or you already own one. It remains close to the newer chip in the cited gaming tests while using less power in the cited comparison.
Read the review roundup →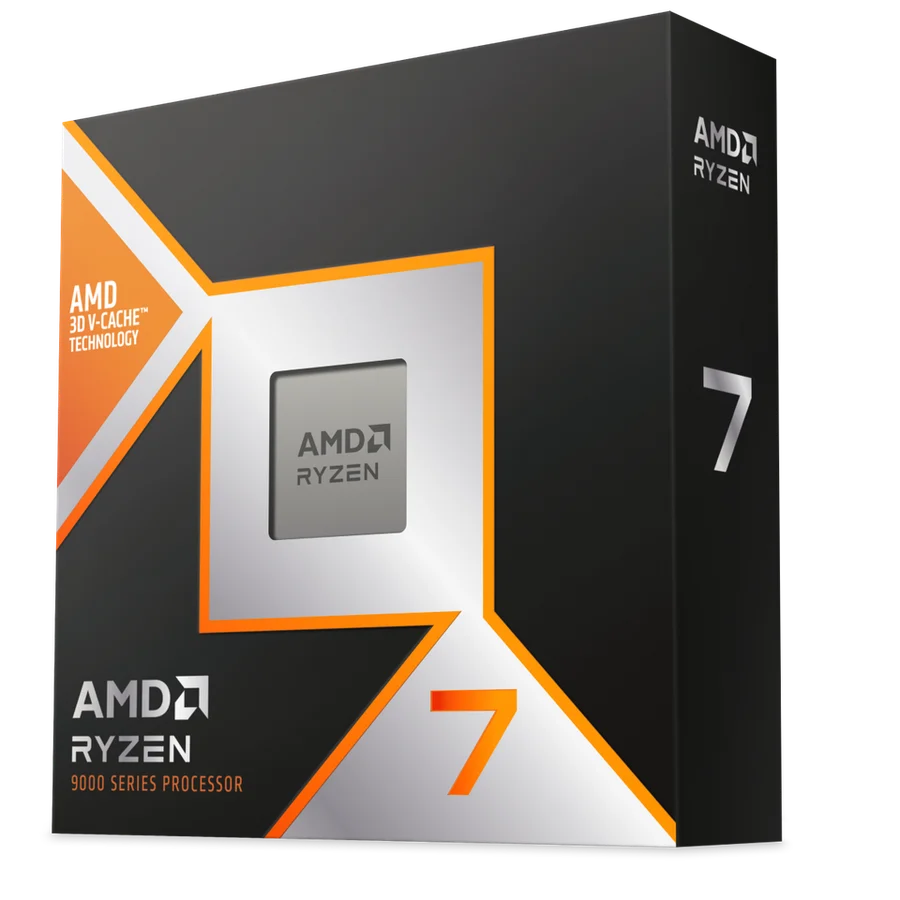
You are assembling a high-end gaming PC, the extra cost is modest, and your games are CPU limited. The higher clock is useful when the rest of the system can expose that advantage.
Read the review roundup →Tom’s Hardware and TechSpot both put the newer chip ahead in their gaming suites, but the size of the lead differs. That is useful context rather than a contradiction: suites contain different games and settings. The charts below preserve each publisher’s results separately. A CPU-limited gaming average does not predict your result at a higher resolution with a slower graphics card.
Sources: Tom’s Hardware [1] · TechSpot [3]Both processors use the AM5 platform and share the same core count. The 9850X3D’s extra clock speed comes with higher measured gaming power in the cited testing. Account for cooling and platform costs before spending the entire budget on the processor. A lower power figure by itself also does not establish efficiency in every task.
Sources: Tom’s Hardware [1] · GamersNexus [2] · TechSpot [3]For a new build, a small premium can be reasonable if it does not compromise the GPU or memory budget. For a current 9800X3D owner, replacing the processor involves paying for the entire new chip to gain a comparatively small improvement. Check your actual frame rates and CPU limits first. These gaming results do not establish a winner for long compilation or rendering work.
Sources: Tom’s Hardware [1] · GamersNexus [2] · TechSpot [3]These are the exact configurations compared below. Retailer prices appear when a current matching offer is available; search links do not imply stock or a verified price. Benchmarks stay separate when their workloads or test conditions differ.
Desktop AM5 processor; separate from 9800X3D
Start with your games, resolution and settings. Compare native rendering separately from upscaling and generated frames.
Ryzen 7 9850X3D: 211.2 FPS, the highest reported result in this test. Results apply to these test settings.
Same publication’s direct 9850X3D versus 9800X3D comparison; 16-game 1080p geometric mean.
CPU-limited gaming test. Differences can shrink at higher resolutions or with a slower GPU; these are not compilation results.
Ryzen 7 9800X3D: 81.4 W, the lowest reported result in this test. Results apply to these test settings.
Gaming power figures reported in the same 9850X3D versus 9800X3D comparison.
Workload power, not TDP or whole-system consumption. Lower consumption alone does not establish better efficiency.
Gaming builds with a meaningful price saving
The 9850X3D can be a little faster
GamersNexus supplies workload, thermals and memory-context testing. A gaming-focused cache design does not establish a universal workstation winner.
GamersNexus ↗TechSpot finds the 9850X3D about 5% ahead in its 14-game suite, shrinking around GPU limits. Tom’s Hardware reports a smaller 3.2% gap in its own suite.
TechSpot ↗Tom’s Hardware ↗New gaming builds chasing peak CPU performance
Small gains, with higher power use
The boost specification rises while cores and cache stay the same. Lightly threaded and CPU-limited workloads can benefit more than a GPU-limited game.
Tom’s Hardware ↗TechSpot ↗TechSpot’s external EPS measurement and Tom’s Hardware both find additional power demand. Their measurement methods must remain separate.
TechSpot ↗Tom’s Hardware ↗Enter the prices you can buy at to compare the real premium. A launch price or a higher model number does not establish better value.
Specifications reported for every selected model. A difference does not automatically mean better.
Compare results from the same test and settings.
Ryzen 7 9850X3D: +6.6 FPS (+3.2%) versus Ryzen 7 9800X3D. Higher results are better in this test.
Same publication’s direct 9850X3D versus 9800X3D comparison; 16-game 1080p geometric mean.
CPU-limited gaming test. Differences can shrink at higher resolutions or with a slower GPU; these are not compilation results.
Tom’s Hardware · 2026 comparison ↗Ryzen 7 9850X3D: +24.6 W (+30.2%) versus Ryzen 7 9800X3D. Lower results are better in this test.
Gaming power figures reported in the same 9850X3D versus 9800X3D comparison.
Workload power, not TDP or whole-system consumption. Lower consumption alone does not establish better efficiency.
Tom’s Hardware · 2026 comparison ↗Ryzen 7 9850X3D: +21 W (+14.7%) versus Ryzen 7 9800X3D. Lower results are better in this test.
Matched all-core load. PMD interposer measures EPS12V power before motherboard VRM losses. Results checked against GamersNexus’s written adaptation of this video.
Includes VRM losses. This is not TDP, gaming power or whole-system power. Do not combine with the separate gaming-power dataset.
GamersNexus · January 28, 2026 ↗3 tests compare at least two selected models. See Benchmarks for the results.
 Watch on YouTube ↗
GamersNexus ·
Gaming gains range from effectively nothing to about 4% over the 9800X3D. The 9850X3D also runs hotter and draws more power in the matched all-core test. A small clock increase offers little reason for an existing 9800X3D owner to upgrade.
Read the written review ↗ · Checked 2026-10-03
This is our buying analysis of published reviews, not hands-on testing by Next Interrupt. Recommendations combine the cited findings with practical purchase considerations. Review samples may differ from the configurations offered by retailers; those differences are called out above and in the comparison. Read our methodology.
Help choosing
Key differences, review evidence and who should buy each model.