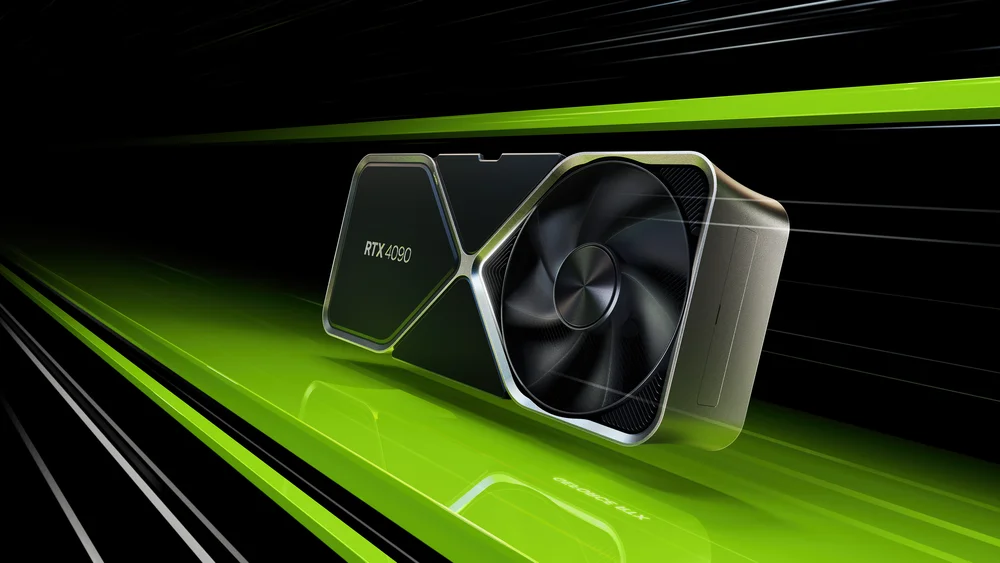
GeForce RTX 4090
24GB desktop GPU; Founders Edition benchmark sample
Or trySearch Newegg ↗
Help choosing
Key differences, review evidence and who should buy each model.
Compare AirPods Pro 3 and Bose QuietComfort Ultra Earbuds 2 for iPhone integration, fit, noise cancellation, battery evidence and current retailer offers.
Read comparison →ProcessorsShould you pay more for the Ryzen 7 9850X3D? Compare sourced gaming and power tests, AM5 build costs and the upgrade case against the 9800X3D.
Read comparison →Graphics cardsRTX 5070 or RX 9070 for a gaming PC? Compare 12GB versus 16GB memory, native gaming, ray-tracing tradeoffs and current prices.
Read comparison →Graphics cardsCompare RTX 5070 Ti and RX 9070 XT using sourced gaming benchmarks, ray-tracing tradeoffs, board requirements and current retailer prices.
Read comparison →Handheld gamingChoose between Nintendo Switch 2 and Steam Deck OLED by game library, handheld experience, compatibility, storage and total ownership cost.
Read comparison →VR headsetsIs Quest 3 worth the extra over Quest 3S? Compare lens clarity, 512GB versus 128GB storage, comfort and the cost of starting VR.
Read comparison →SSD storageCompare the 2TB Samsung 990 PRO and WD_BLACK SN850X for gaming, application performance, cooling and exact-model retailer pricing.
Read comparison →LaptopsCompare the 13-inch M5 MacBook Air and base-M5 14-inch MacBook Pro for portability, sustained work, displays, ports and configuration costs.
Read comparison →PhonesCompare iPhone 18 Pro and Galaxy S26 Ultra for phone size, ecosystem, camera use, S Pen and the value of upgrading an existing flagship.
Read comparison →24GB desktop GPU; Founders Edition benchmark sample
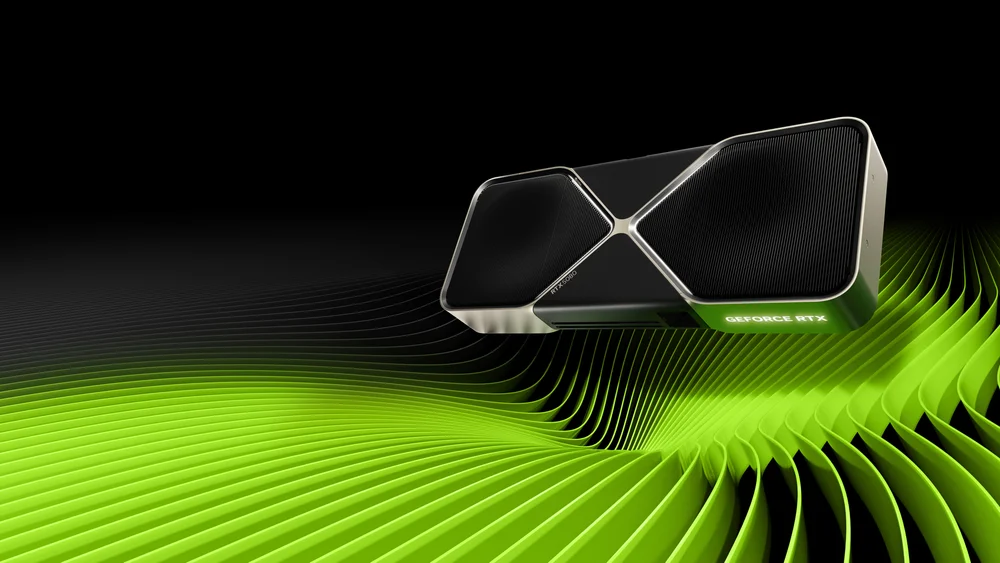
16GB desktop GPU; Founders Edition benchmark sample
Frame rates in real games at your resolution matter most. Upscaling and frame generation can add a lot on top.
GeForce RTX 4090: 84.4 FPS, the highest reported result in this test. Results apply to these test settings.
Founders Edition cards; Ryzen 7 9800X3D, 32GB DDR5-6000 CL30. Same launch-review test system. Native rasterization, 3840 × 2160; geometric mean. No upscaling or generated frames.
Historical launch-review snapshot. Later drivers, games and software may change results.
GeForce RTX 4090: 126.8 FPS, the highest reported result in this test. Results apply to these test settings.
Founders Edition cards; Ryzen 7 9800X3D, 32GB DDR5-6000 CL30. Same launch-review test system. Native rasterization, 2560 × 1440; geometric mean. No upscaling or generated frames.
Historical launch-review snapshot. Later drivers, games and software may change results.
GeForce RTX 4090: 24 GB. A larger memory pool may fit a larger workload; it does not establish higher frame rates.
Native 4K performance and workloads needing more than 16GB VRAM
Higher measured power and a larger Founders Edition cooler
At 4K Ultra, the cited 16-game geometric means are 84.4 FPS for the 4090 and 70.1 FPS for the 5080. Use the interactive comparison to change resolution and inspect 1% lows.
Tom’s Hardware ↗The 4090 provides 24GB versus 16GB on the 5080. Capacity is not a speed benchmark: check the memory footprint of your model, context length, application and precision.
TechSpot ↗A new high-end build balancing gaming performance and power
Less VRAM and lower native gaming performance than the RTX 4090
Having only 16GB of memory severely limits its practicality for memory-intensive professional workloads such as video editing and rendering.
GamersNexus ↗At 4K Ultra, the cited 16-game geometric means are 84.4 FPS for the 4090 and 70.1 FPS for the 5080. Use the interactive comparison to change resolution and inspect 1% lows.
Tom’s Hardware ↗Have prices in hand? Enter them to see exactly how much more each one costs.
Results from the same test and settings.
GeForce RTX 5080: -14.3 FPS (-16.9%) versus GeForce RTX 4090. Higher results are better in this test.
Founders Edition cards; Ryzen 7 9800X3D, 32GB DDR5-6000 CL30. Same launch-review test system. Native rasterization, 3840 × 2160; geometric mean. No upscaling or generated frames.
Historical launch-review snapshot. Later drivers, games and software may change results.
Tom’s Hardware · January 29, 2025 ↗GeForce RTX 5080: -14.9 FPS (-11.8%) versus GeForce RTX 4090. Higher results are better in this test.
Founders Edition cards; Ryzen 7 9800X3D, 32GB DDR5-6000 CL30. Same launch-review test system. Native rasterization, 2560 × 1440; geometric mean. No upscaling or generated frames.
Historical launch-review snapshot. Later drivers, games and software may change results.
Tom’s Hardware · January 29, 2025 ↗GeForce RTX 5080: -104 W (-25.9%) versus GeForce RTX 4090. Lower results are better in this test.
Founders Edition cards; Ryzen 7 9800X3D, 32GB DDR5-6000 CL30. Same launch-review test system. PCAT v2 measured graphics-card power; geometric mean across 19 games at 4K Ultra raster/DXR.
Measured card consumption, not manufacturer TGP or whole-PC power. Different suite from the 16-game FPS average; do not combine into FPS per watt.
Tom’s Hardware · January 29, 2025 ↗GeForce RTX 5080: -22.7 FPS (-16.4%) versus GeForce RTX 4090. Higher results are better in this test.
Founders Edition cards; Ryzen 7 9800X3D, 32GB DDR5-6000 CL30. Same launch-review test system. DX12, 3840 × 2160 Ultra, FPS Target Off; native rendering.
Historical launch-review snapshot. Later drivers, games and software may change results.
Tom’s Hardware · January 29, 2025 ↗8 tests compare at least two selected models. See Benchmarks for the results.
 Watch on YouTube ↗
GamersNexus ·
The 4090 stays ahead in the 4K games examined here. Gains over the 4080 vary considerably by game, making the 5080 a more convincing replacement for older cards. Cooling results apply to the Founders Edition.
Read the written review ↗ · Checked 2026-10-03
 Watch on YouTube ↗
Hardware Unboxed ·
The 5080 improves on the 4080 Super by 4% at 1440p and 11% at 4K in this suite. The compact cooler fares well, but those modest gains weaken the upgrade case. This is the video version of the TechSpot review already included in our sources.
Read the written review ↗ · Checked 2026-10-03