A close gaming contest
TechSpot finds the 9850X3D about 5% ahead in its 14-game suite, shrinking around GPU limits. Tom’s Hardware reports a smaller 3.2% gap in its own suite.
TechSpotTom’s HardwareCPUs & PC components / Review roundup
Desktop AM5 processor
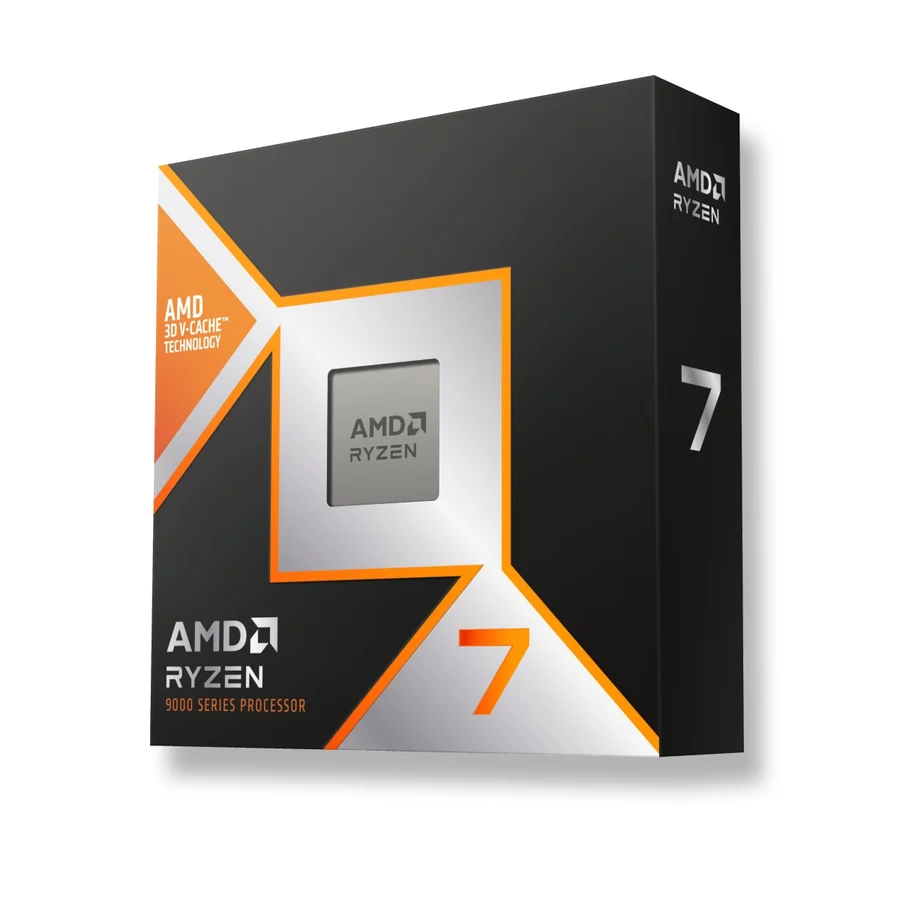
Roundup updated 2026-10-02 · 3 assessment sources · 1 additional review
What reviewers found
The 9850X3D is only a little faster in the reviewed gaming suites, while the 9800X3D uses less power. For a new build, a useful saving here can go toward the graphics card or storage. Existing 9800X3D owners have little reason to replace it for such a small gaming improvement.
A roundup of published reviews; we haven’t tested this product. How we work
Gaming builds with a meaningful price saving
The 9850X3D can be a little faster
Affiliate links · We may earn a commission.
PERFORMANCE
Ryzen 7 9800X3D records 12.8% lower power consumption than Ryzen 7 9850X3D in this test. This is consumption, not a performance-per-watt ranking.
GamersNexus · original chart & methodology ↗Published January 28, 2026 · checked 2026-10-03
Matched all-core load. PMD interposer measures EPS12V power before motherboard VRM losses. Results checked against GamersNexus’s written adaptation of this video.
Includes VRM losses. This is not TDP, gaming power or whole-system power. Do not combine with the separate gaming-power dataset.
| Product | Result | Against first measured model |
|---|---|---|
| Ryzen 7 9800X3D | 143 | 0% |
| Ryzen 7 9850X3D | 164 | 14.7% |
Bars start at zero. Percentage differences use the displayed baseline; they are not a combined rating. A geometric mean summarizes a suite, not the frame rate of every game. 1% lows describe the slowest portion of frames and help expose uneven delivery. Missing products are never assigned zero.
TechSpot finds the 9850X3D about 5% ahead in its 14-game suite, shrinking around GPU limits. Tom’s Hardware reports a smaller 3.2% gap in its own suite.
TechSpotTom’s HardwareBoth CPUs share the same socket and core count. A price saving is most useful when it improves the GPU, memory or the rest of the system.
Tom’s HardwareGamersNexus supplies workload, thermals and memory-context testing. A gaming-focused cache design does not establish a universal workstation winner.
GamersNexusPublished measurements include their original test conditions.
Measurement · 1080p gaming geometric mean
204.6 FPSTom’s Hardware 16-game suite; 9850X3D scored 211.2 FPS in the same setup. CPU-limited test, not your GPU-limited frame rate.
Tom’s HardwareMeasurement · Average gaming power
81.4 WTom’s Hardware gaming measurement versus 106 W for 9850X3D; separate from the 120 W TDP rating.
Tom’s HardwareCheck the configuration: memory, storage and cooling can vary between models.
 Watch on YouTube ↗
GamersNexus ·
Gaming gains range from effectively nothing to about 4% over the 9800X3D. The 9850X3D also runs hotter and draws more power in the matched all-core test. A small clock increase offers little reason for an existing 9800X3D owner to upgrade.
Read the written review ↗ · Checked 2026-10-03
TechPowerUp · Review ·
Publisher excerptThe AMD Ryzen 7 9800X3D set new benchmarks in gaming performance with its impressive 96 MB L3 V-Cache. But how does memory latency factor into this powerhouse's performance? Our latest analysis dives deep into memory performance scaling, and could change how gamers approach system optimization.
Tom’s Hardware · Review ·
16-game comparison reports a small 9850X3D lead with higher gaming power; platform and productivity evidence are assessed separately.
Direct comparison: gaming, productivity and power
Publisher group: Future
GamersNexus · Review
Additional gaming, power, thermals and memory-context testing. Read the workload and DDR5 configuration before extrapolating.
9850X3D testing with 9800X3D comparison results
Publisher group: GamersNexus
TechSpot · Review
14-game comparison finds a small refresh uplift that shrinks with GPU limits; external EPS power measurements add a separate efficiency perspective.
14-game CPU comparison, workload scaling and externally measured power
Publisher group: TechSpot